Fibonacci retracement is a method investors use in technical analysis to determine potential areas of support and resistance. These levels are derived from the Fibonacci sequence of numbers whose ratios provide price levels to which markets can potentially retrace a portion of their move before the price action continues in their original direction. These price levels appear as horizontal lines indicating where supports and resistances are likely.
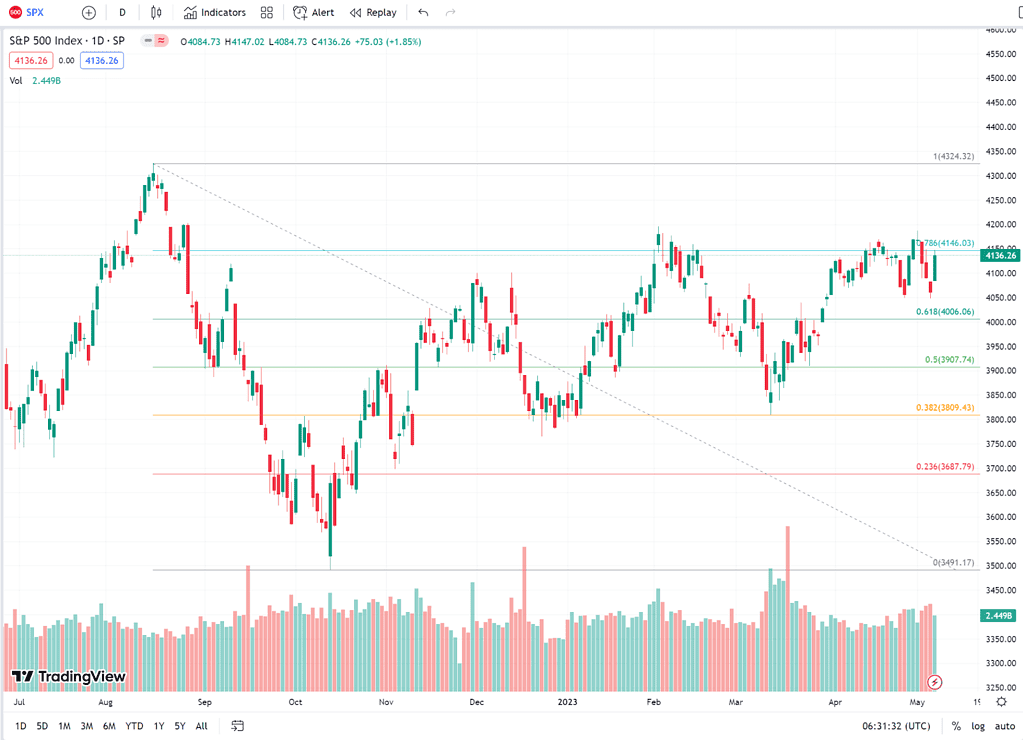
Each level is associated with a percentage. The percentage is how much of a prior move the price has retraced. The Fibonacci retracement levels are 23.6%, 38.2%, 61.8%, and 78.6%. 50% is also used by other traders even though it is not a Fibonacci level. Fibonacci retracement levels were named after Italian mathematician Leonardo Bigollo Pisano — or more famously known as Leonardo Fibonacci (shortened from fillius Bonacci, or “son of Bonacci.”) It should be noted that Fibonacci did not create the famous sequence. Instead, he introduced these numbers to Western Europe after learning about them from Indian merchants.
How to Calculate Fibonacci Levels
Suppose the price of a stock rises $10 and then drops $2.36. In this case, it has retraced 23.6%, a Fibonacci number. The value is taken by drawing 2 significant price points (high and low), and the indicator will create the price levels between 2 points. The great thing about charting tools is that they simply calculate these points of reference based on where you place the 2 starts and end of the level.
Take a look at this TSLA chart. Once the Fibonacci levels are applied, the tool automatically calculates the ratio for you to see areas of potential resistance easily.
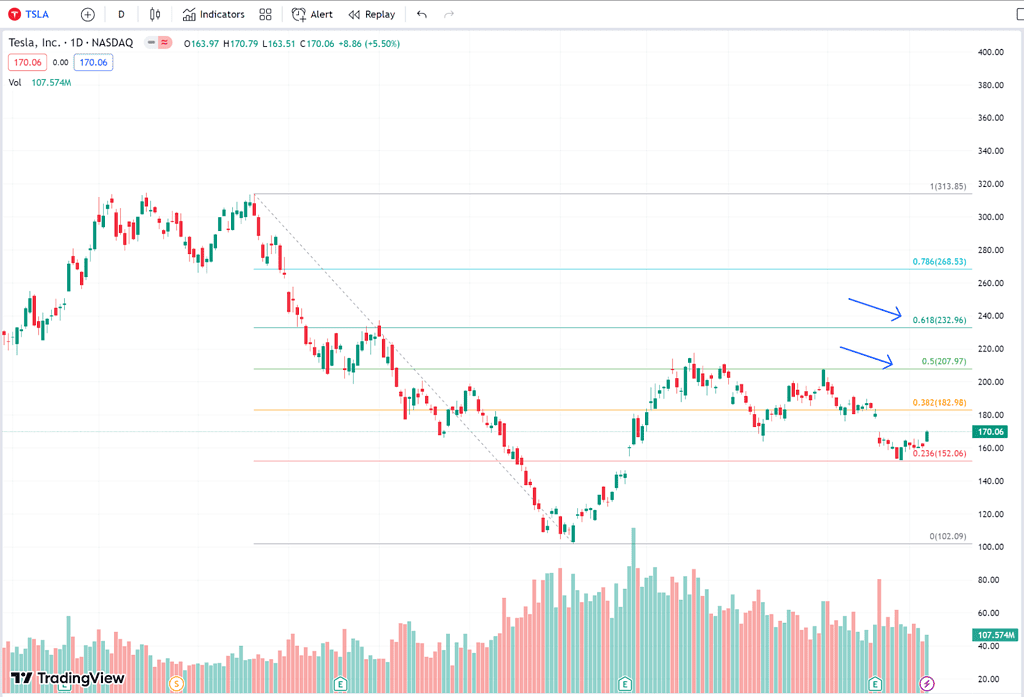
Applying Fibonacci Retracement Tool to Your Chart
Most trading and charting software packages already have drawing tools allowing users to create their analyses. For example, in the TradingView chart, you can click on the drawing tools it has on the left and choose “Fib Retracement.”
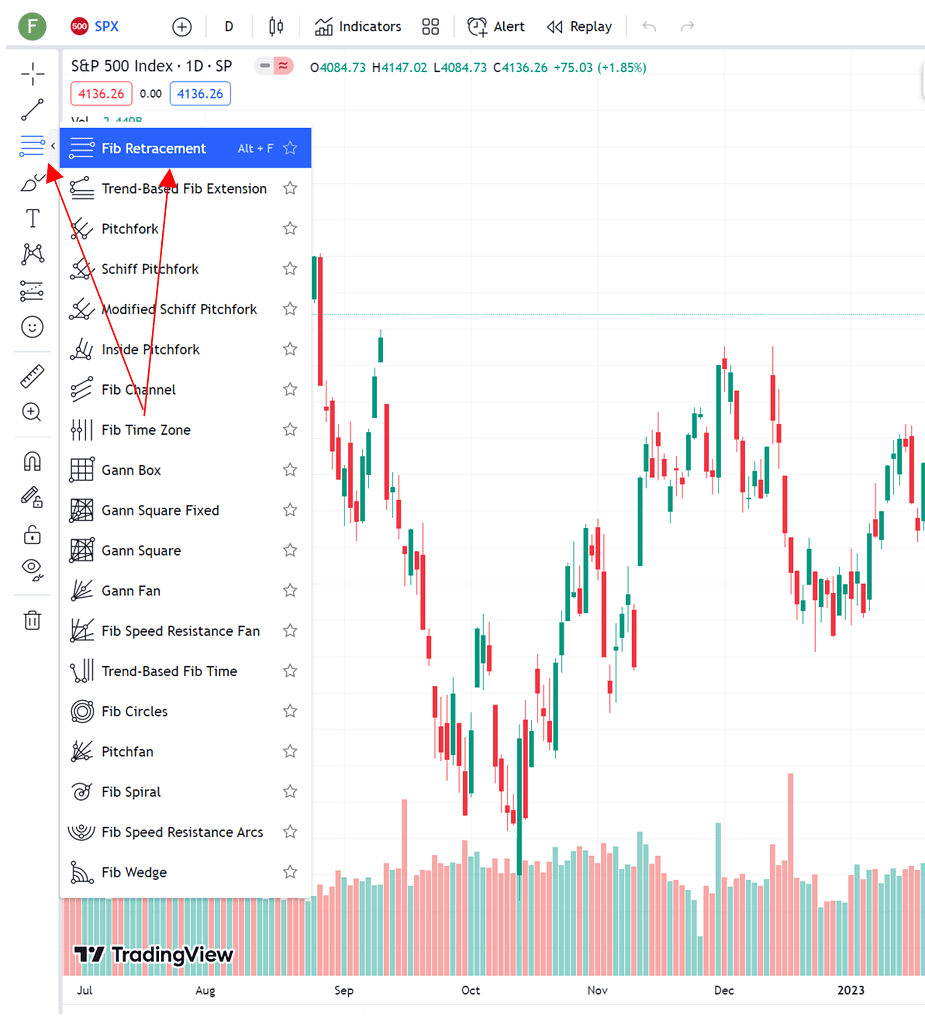
From there, you can click on any of the swing highs and swing lows that you would like to place your retracement tool info on. The rule of thumb is you plot from high to low if you are trying to plot levels on the price that you perceive to continue downward and in reverse for stocks that are moving up.
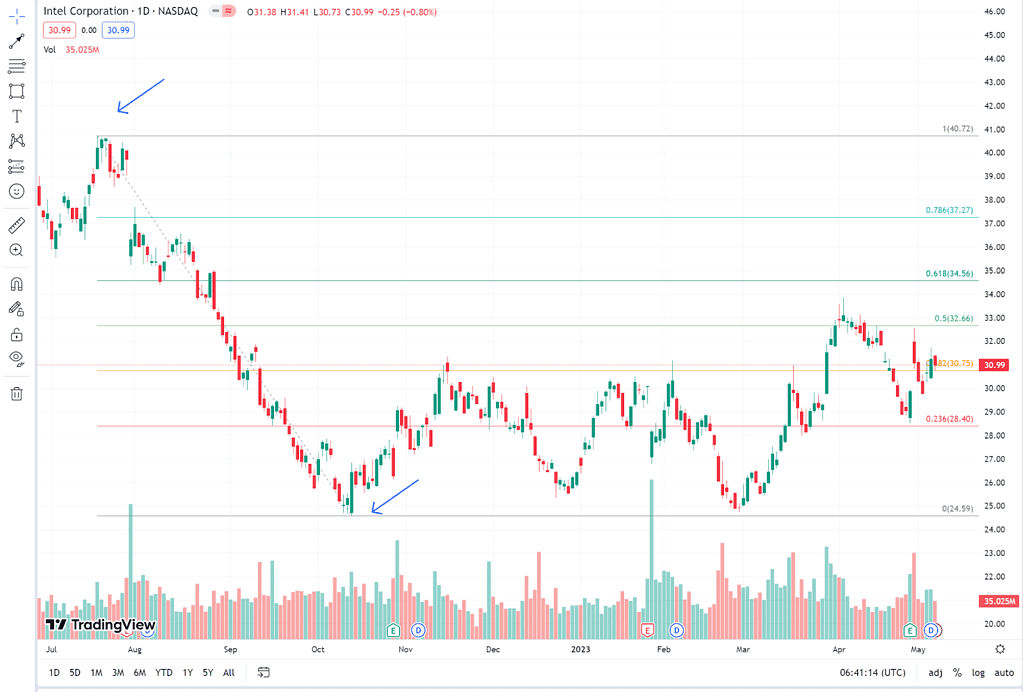
This will then overlay the levels that show potential areas of support/resistance.
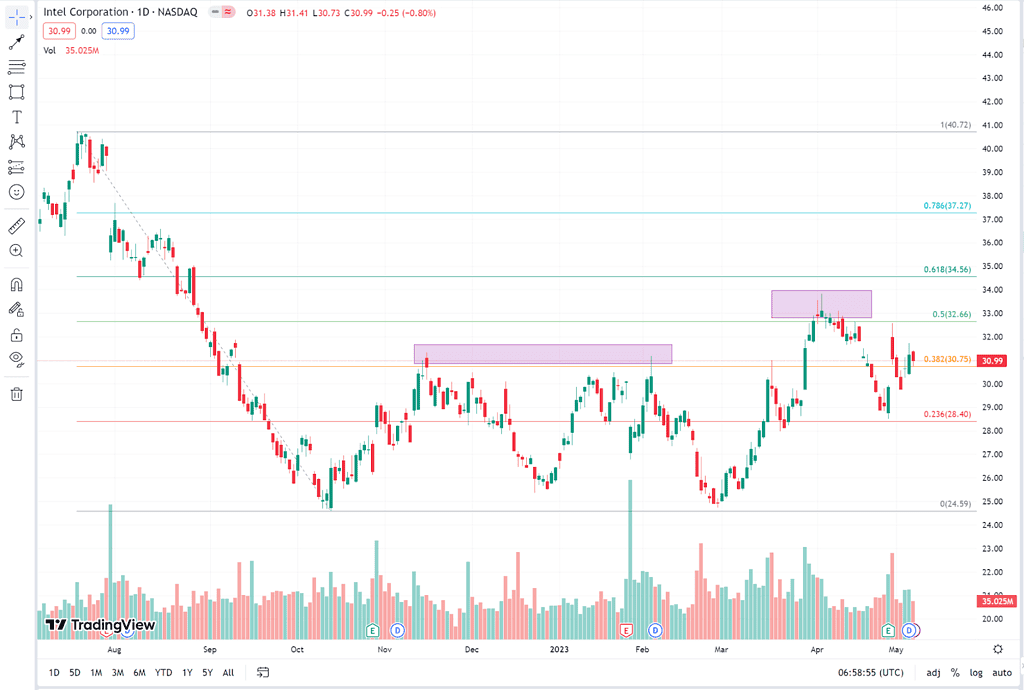
How To Modify Your Fibonacci Retracement Settings
You can set up or modify your Fibonacci retracement level by highlighting your plotted levels, right-clicking, and choosing settings to open up the menu. The menu allows you to set the retracement levels, type of lines, color, etc. You can also include additional levels for the lines.
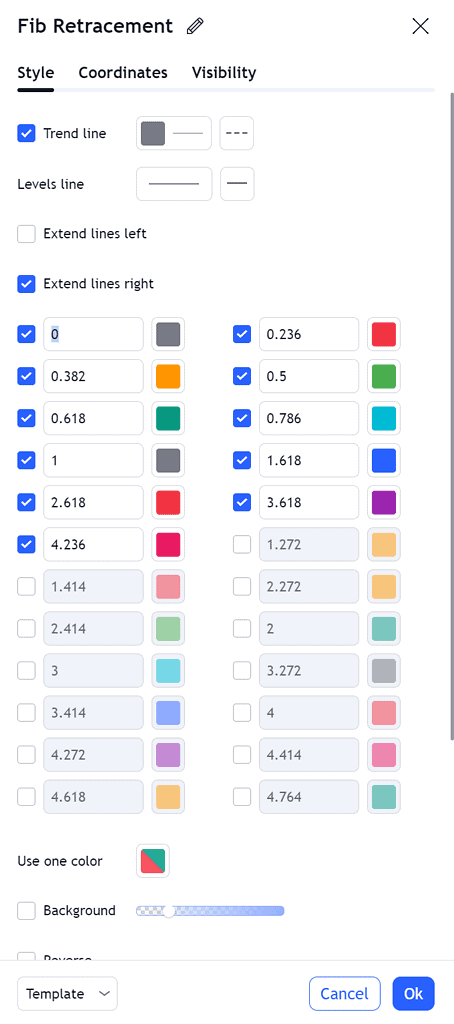
You will also notice the addition of values above 1(100%) in the settings. These are called “Fibonacci Extensions”.
What Are Fibonacci Extensions?
Fibonacci extensions are also based on the Fibonacci sequence and are used to project price levels or profit targets beyond the current range of high and low prices. These are typically used to project potential resistance, overextensions of price swings, etc. We will look more into extensions in future articles.
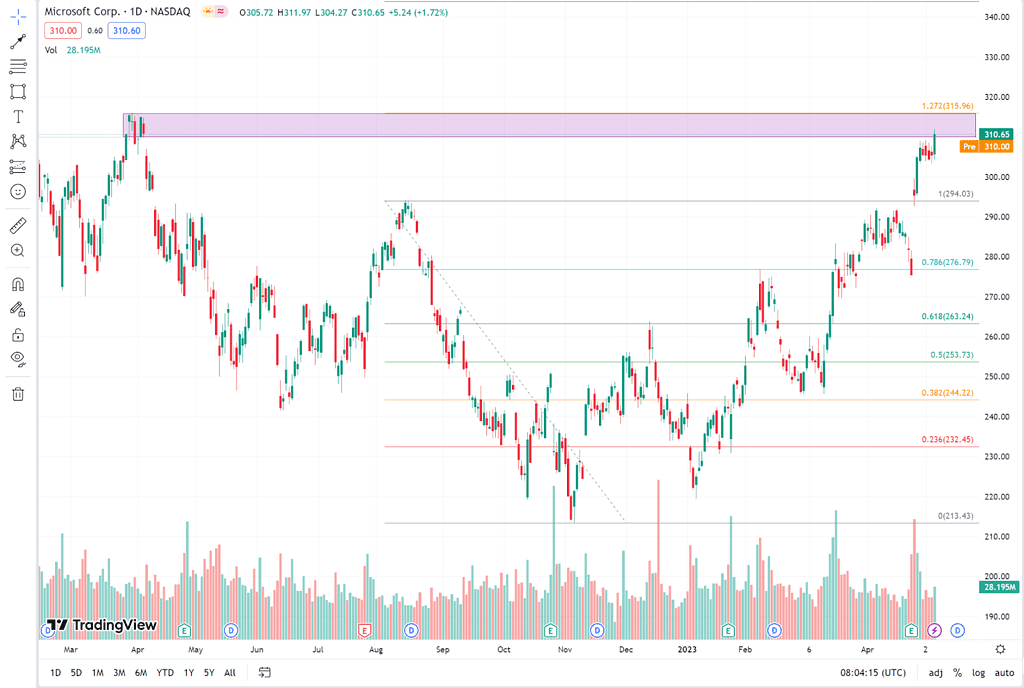
What Is the Significance of Each Level?
Each level of the sequence provides context on price corrections and the current strength of the swing. For example:
- 23.6% – considered the weakest level of support or resistance and is typically used to determine the depth of a correction.
- 38.2% – considered as the first level of significant support or resistance and is used to confirm the direction of a trend.
- 50% – this level is a key level of support or resistance (even though it is not part of the Fibonacci sequence) and is considered a potential turning point in a trend.
- 61.8% – this level is the second level of significant support or resistance and is considered the most important ratio (alongside (1.618 extensions) of the levels most traders commonly follow and consider as a psychological line where traders are believed to behave similarly in this level.
- 78.6% – this level is the final level of support or resistance and is considered the last line of defense of the trend.
How to Apply Fibonacci Tool in Your Trading
Fibonacci retracement can be applied in various ways, traders can use it to determine potential turning points as well as project areas to take profit within the current range.
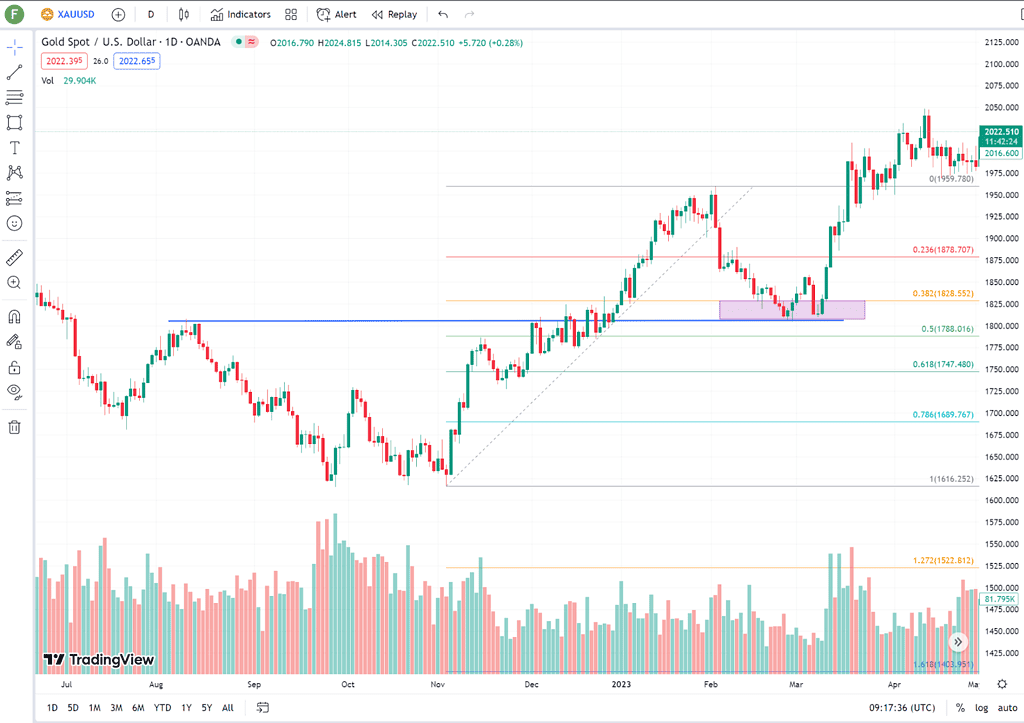
For example, you can buy into retracements and exploit ongoing trends. This chart for gold shows its swing from $1616-1959. Traders can wait for prices to “react” on the .236 and .328 levels (which coincide with previous resistance and support) and find potential opportunities to buy into the commodity.
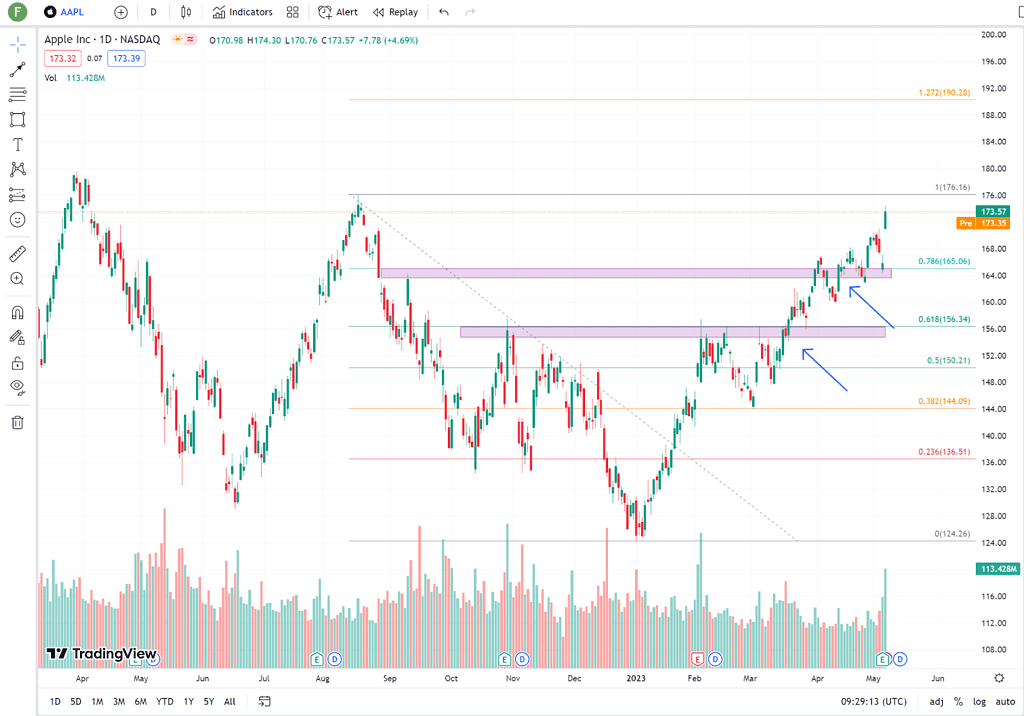
Traders can also use it as a potential target for trades. Suppose a trader bought into the low of Apple with the conviction that prices would remain sideways or continue to go down. In that case, price levels with previous price support and resistance levels can be used as scaling targets (incremental target levels) or the main profit areas of any trader that has bought into the position.
Limitations of Fibonacci Retracement Tool
- Subjectivity – One of the main limitations of the Fibonacci Retracement tool is that it depends on the points being connected as levels will be populated based on the chosen swing.
- Cannot work on its own to make the trade – Another limitation is that it is a tool that tells you which areas prices can potentially turn, but it is not an exact buy or sell signal for traders.
- No assurance that price will reverse on key levels – Due to prices moving based on different factors, there is no assurance price will reach or reverse at a given extension level.
Best Practices When Using Fibonacci Retracement
- Use confluence with historical resistance and support levels. More confluence with previous support areas increases the likelihood of that price level becoming a turning point.
- Use in conjunction with other strategies like using candlestick patterns, momentum oscillators, moving averages, etc.
- Always analyze the market environment (bearish/bullish) when plotting to better understand the best direction to follow (long/short).
Final Thoughts
The Fibonacci Retracement Tool is one of the most flexible and useful tools any trader can add to their arsenal. While the tool is not foolproof and should be used with other tools to increase efficiency, Fibonacci retracements’ ability to provide key potential areas of support and resistance in a trend can provide a trader additional insights in areas that can potentially be a winning trade.

