Investors will encounter different sets of technical indicators like RSI, MACD, Moving Averages, Bollinger Bands, etc. Two of the most common ones are Exponential and Simple Moving Averages. Newbie traders and investors may be confused about the difference between these indicators and how to apply them to their investing strategies. In this article, we will take a look at each one, discuss how to apply them, and help you choose which one work for you.
Simple Moving Average (SMA)
The simple moving average (SMA) is a technical indicator that provides a smoothed representation of price data for a defined period. It calculates the average price by doing a simple average of all the close prices of all the periods you specify. This method gives equal weightage to all the data in the defined frequency and period.
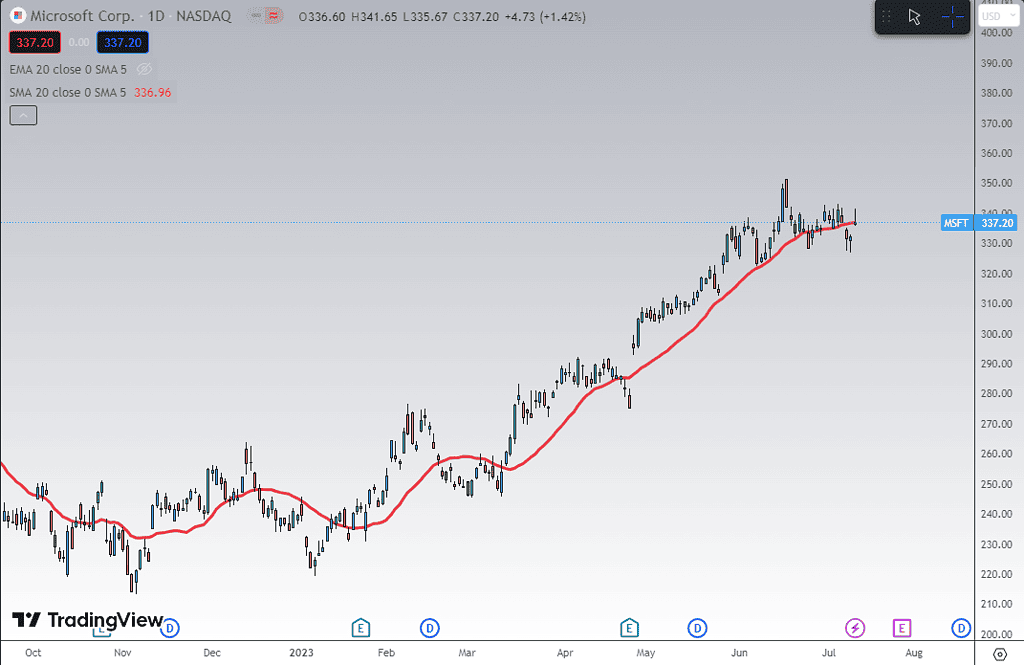
Sample of a 20-day SMA

Exponential Moving Average (EMA)
On the other hand, the exponential moving average (EMA) also provides a smoothed representation of price for a defined period and frequency but gives more weighting or importance to recent price data. This makes EMA more responsive to sudden changes in price.
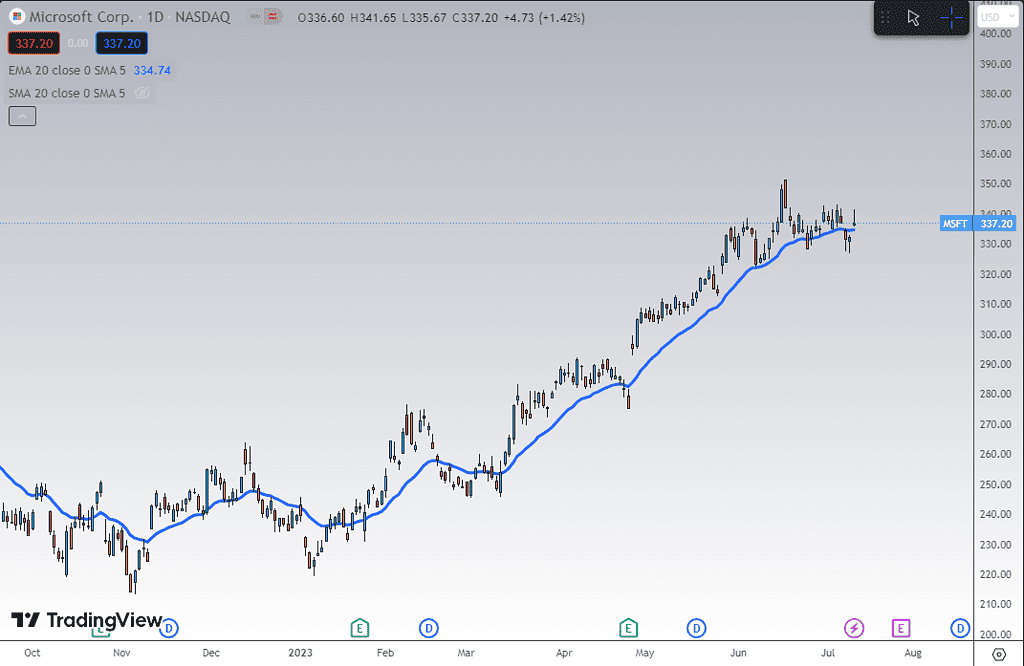
Sample of 20-day EMA

How are they calculated?
SMA and EMA are statistical technical indicators that smooth out a security’s price by taking its average price over a specified period. They are commonly represented as a line on a chart. They reflect the average value of a security over a given period, and the Simple Moving Average uses a mean calculation for the entire period and uses an equal weight for each data point when calculating for the SMA.
The formula for SMA:

The EMA, however, uses a different weighting method than SMA; it adds more weight to the most recent data to make it more responsive to price changes.
The formula for EMA:

Advantages of SMA and EMA
While both are moving averages, they each have their advantages against the other. Let’s look at some of those in detail:
Simple Moving Average
Straightforwardness – One of the SMA’s strong points is how it is very straightforward to calculate and interpret. This makes it very accessible to traders of all experience levels and a starting point for most traders and investors looking for a no-fuss indicator.
Smoothed Trend Identification – With its equal-weighted fluctuations averaging, SMA provides traders and investors with a smoother line for easier trend identification.
Historical Price Influence – Due to its treatment of all data points being equal, it provides importance to all data points regardless of their new or older data. This is very useful in analyzing any security’s historical price patterns.
Exponential Moving Average
Responsiveness: Due to its focus on the most recent price action, the EMA reacts more quickly to price changes. Its responsiveness allows traders to see trend changes earlier, potentially providing users a more timely buy or sell signals.
Limited Lag: It also has less lag when compared to SMA’s as it adds more weight to newly added data points, making it a powerful tool for short-term trading strategies.
Adapts to Volatility: With its quick response to new data, EMAs can adjust dynamically to new market volatility. As volatility increases, the EMA will react quickly to these changes, providing traders more accurate representation of price action and prevailing market conditions.
Which should you choose?
With all their merits, the most important question is which should one should you choose? Like any other technical indicator, there isn’t any one type of average a trader can use to guarantee success. The important thing to note is the signal it gives relative to your trading style. To better understand which ones would work for you, let’s look at some things you can consider:
Trade-Offs
While EMA offers enhanced responsiveness, it can be prone to producing false signals during periods of choppy or erratic price movements. With its emphasis on overall trends, SMA may provide a more reliable signal in such situations.
SMA sample:

EMA Sample:

Trading Style
Another thing to consider when choosing to choose between the two is your trading style. Some traders may be more aggressive when entering trades, while others may want to sit back and wait for additional confirmation. For example, since EMAs react faster to price changes, a short-term trader may prefer it over the other SMA, or if you want to take advantage of the entire move, then the EMA would provide you earlier potential signals.

However, if you are a bit more laid back in your trading style and would like to wait for confirmation or an established trend, then the SMA may be a fit for you.

Time Frame Considerations
Choosing which moving average to use is also influenced by a trader’s investment horizon and trading frequency. Traders and investors often use the simple moving average for longer-term analysis (e.g., 50-day, 100-day, or 200-day SMA), while EMA is favored by traders for short-term trade analysis (e.g., 10-day or 20-day EMA).

Applying moving averages to your trading
Now that we have a basic understanding of their difference and advantages, the next question is, how do you include them in your trading strategy? The best thing about moving averages is their flexibility and use case, from compatibility with other indicators to risk management and trend analysis, just to name a few. Let’s take a look at them.
Using moving averages to complement other indicators
You can use EMA as a trigger/signal to compliment other indicators like RSI for a combination of signaling and momentum reading.

As a dynamic “stop loss” for risk management
Another option traders can use moving averages like SMA is using it as a risk management tool. As prices continue to trend up, traders would like to maximize their profit as much as possible. A stop-loss (the price where you will sell the stock to protect your profits) helps you ensure you get the most out of your trade/investment.

Scaling mechanism
One of the advanced terms traders may encounter in their trading journey is the concept of “Mean Reversion.” It is a financial theory that states that prices of securities and their historical returns will eventually go back to their average level or mean. This concept opens up strategies using moving averages as a way to add to trades or hop onto existing trend trades.

Conclusion
Both SMA and EMA are valuable tools that offer unique advantages that will have a place in most traders’ technical analysis toolboxes. While the SMA provides a smoother average line and is simple to interpret, EMA provides users with a responsive moving average that provides earlier signals. It is advisable to test both to better understand their nuances and see which ones would complement your strategy better.

