Articles
Week in Review: AI Selloff Erased the Midterm Rally as Stocks Fell 2.7%

KEY POINTS
- The S&P 500 fell 2.68% for the week to 7,376.86, including a 4.36% drop on Thursday that was its worst day since April 2025.
- October payrolls rose by 165,000 against roughly 59,000 expected, and the 10-year Treasury yield ended the week at 4.86%.
- My discounted cash flow model puts AMD’s fair value between $342 and $464 a share, and the stock closed Friday at $449.04.
Stocks opened the week on shaky footing, caught a lift from the midterm results, and then handed all of it back in a single session. The S&P 500 ended Friday at 7,376.86, down 2.68% for the week, after Thursday’s 4.36% drop, its worst day since April 2025, according to The Closing Print’s weekly summary. The Nasdaq Composite lost 3.37%, the Russell 2000 slipped 2.05%, and the Dow held up best at -0.94%.
Below, I’ll walk through what moved the market, the jobs data, three earnings reports that mattered, and a closer look at Advanced Micro Devices (AMD), the chip stock that swung hardest.
How a Midterm Rally Turned Into an AI Selloff in Two Days
The rally came first. The Nasdaq Composite jumped 2.13% to 25,912.39 on Wednesday after Democrats won control of both chambers of Congress, according to Beinsure, as big technology names recovered from October’s correction.
Then came Thursday. Investors started pricing in the chance that tighter AI and data-center rules could slow the buildout, and the selling hit chips and AI infrastructure hardest. Yahoo Finance framed the week as a post-election rally that turned into an AI trade selloff. The Nasdaq slid into a correction and the VIX jumped nearly 70% in one session. Even after Friday’s drop, the VIX closed at 25.64, up 32% on the week.
Friday brought a bounce, not a recovery. The Nasdaq rose 1.09%, the S&P 500 gained 0.31% and the Dow slipped 0.46%. The Philadelphia chip index jumped 4.2%, yet 318 S&P 500 stocks fell against 184 that rose. In other words, the rebound sat in a narrow group of tech names.
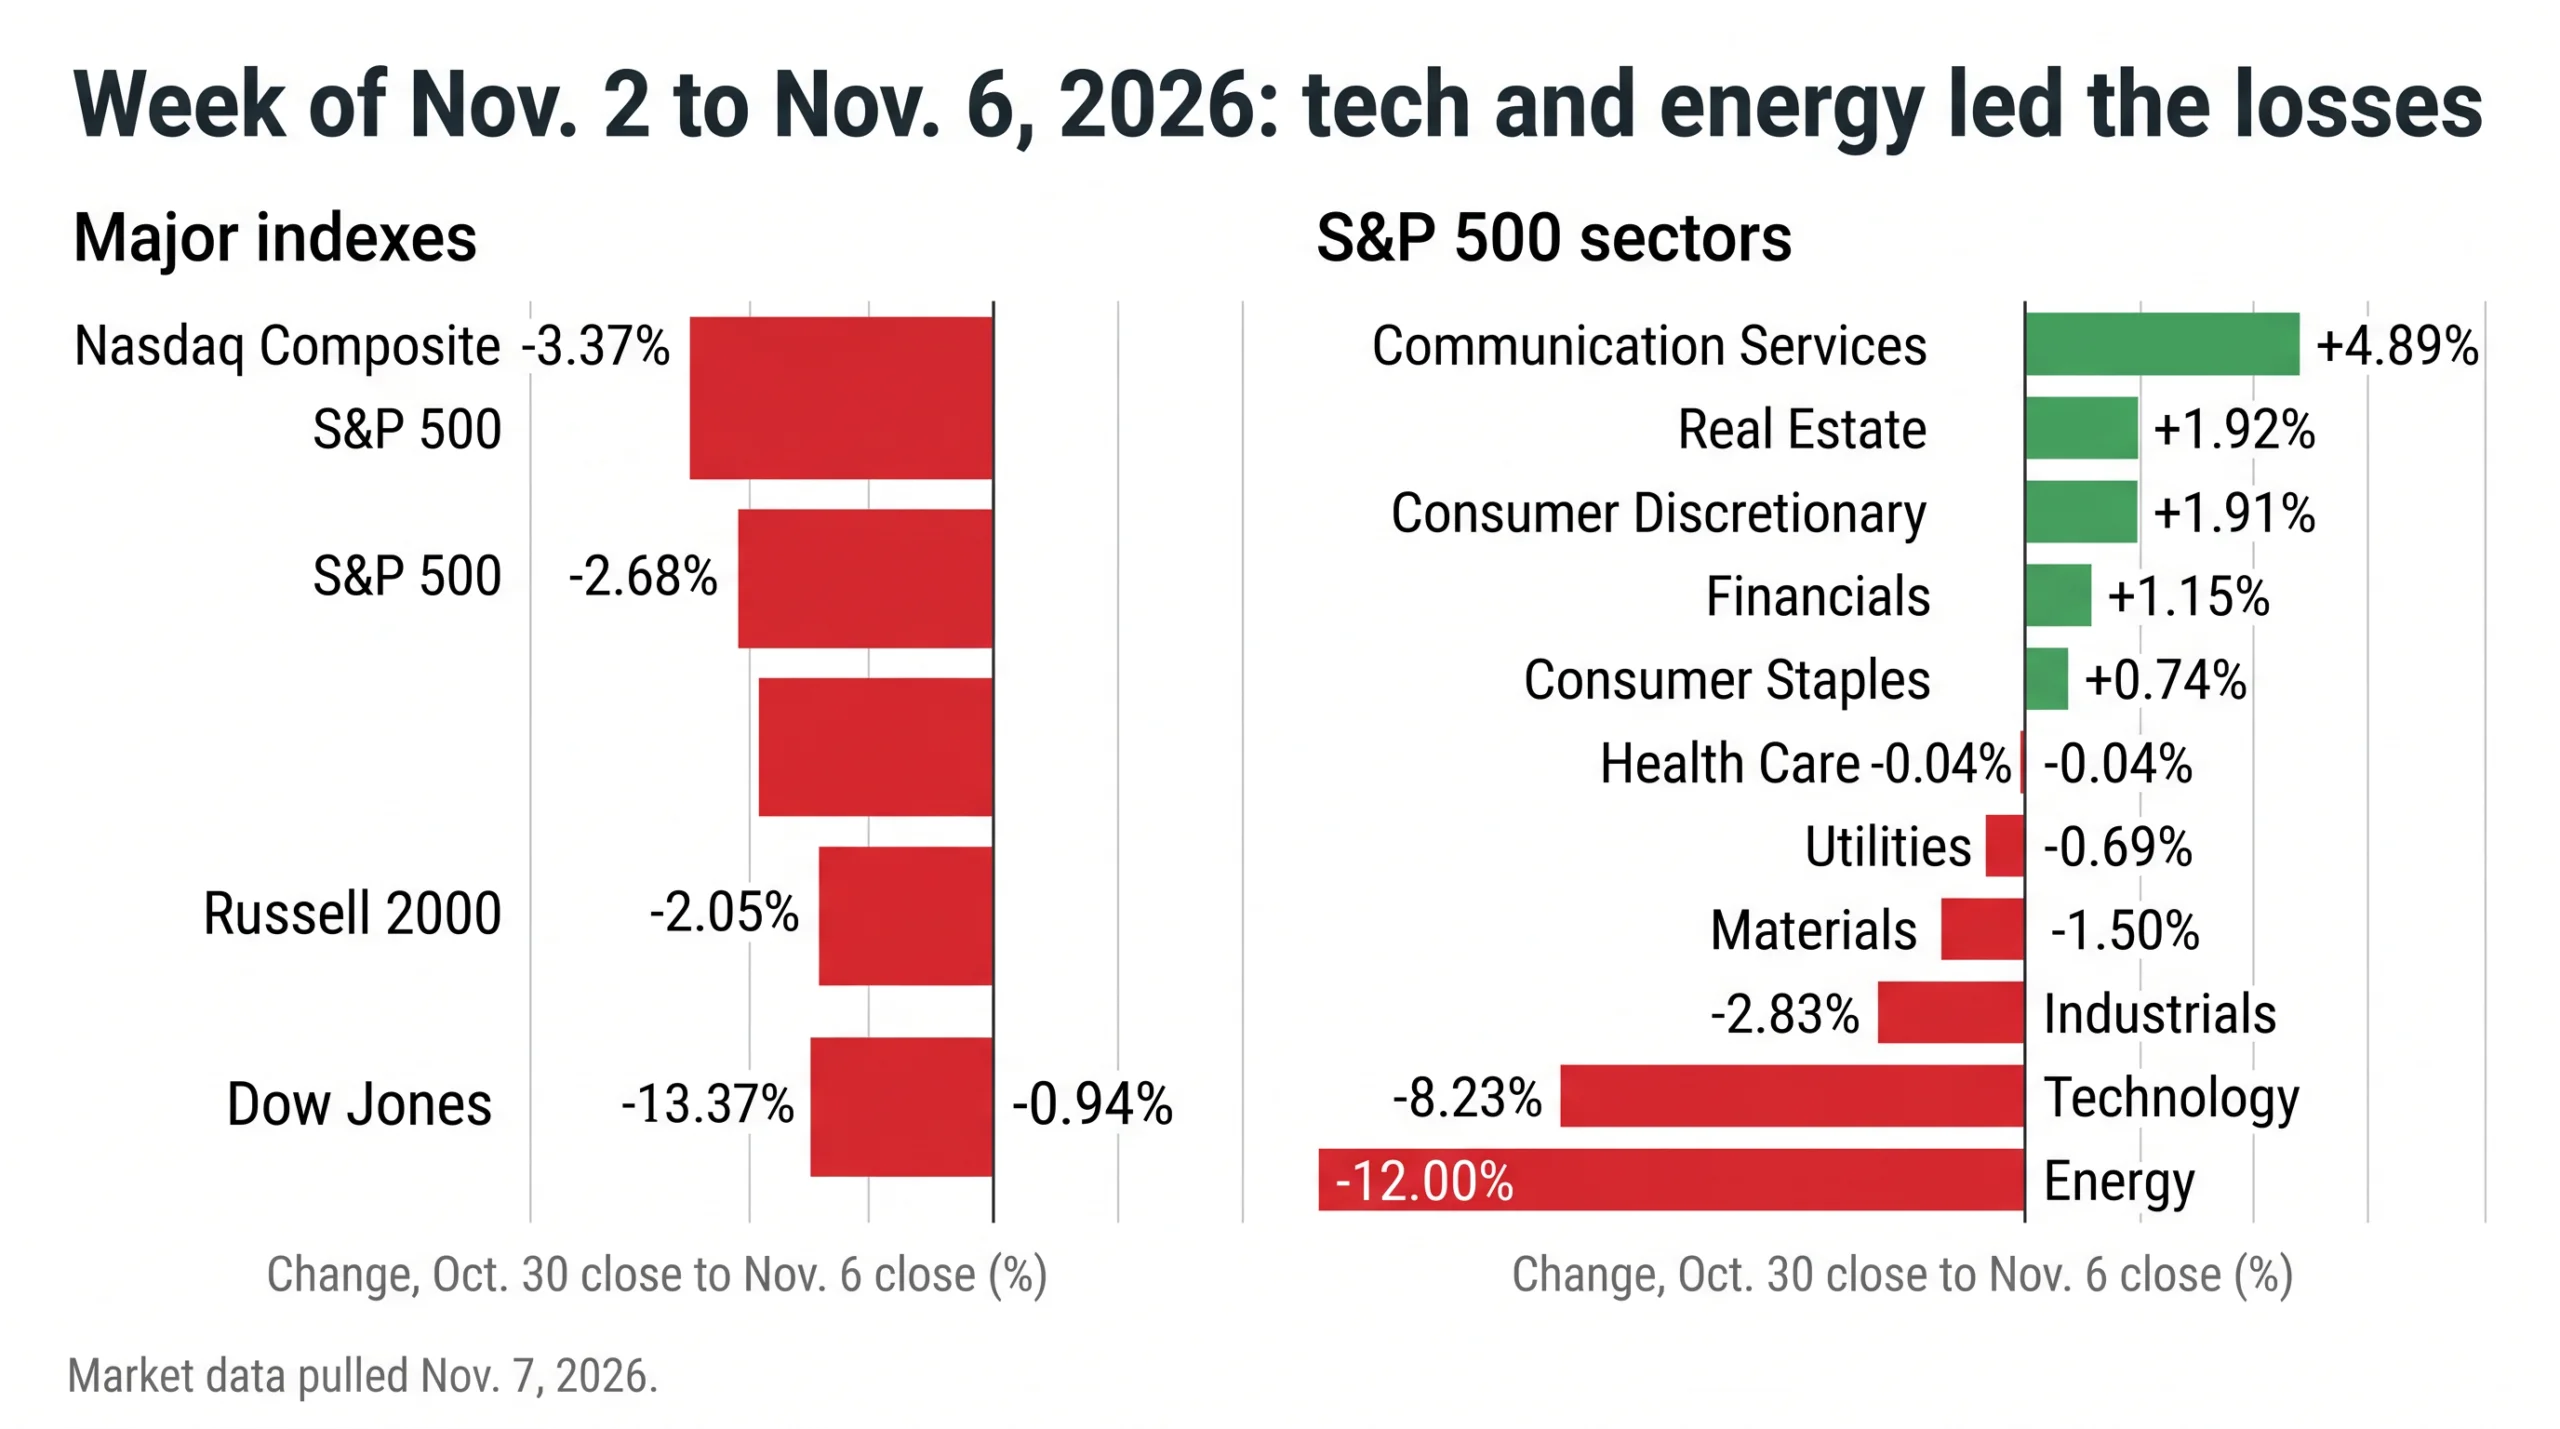
The sector scorecard tells the same story. Energy dropped 12.0% and technology fell 8.2%, while communication services gained 4.9%. Oil explains the energy hit: WTI crude fell about 13% to $90.34 a barrel. Gold rose 4.6% to $4,079.50 an ounce.
The other big event of the week had nothing to do with AI.
A Strong Jobs Report Pushed Yields Higher Into the Weekend
October nonfarm payrolls rose by 165,000, well above the roughly 59,000 economists expected. The unemployment rate eased to 4.1%, and average hourly earnings rose 0.4% from September and 3.1% from a year ago.
Yields firmed on the news. The 10-year Treasury ended the week at 4.86%, down from 4.94% the Friday before, and the 2-year finished at 4.51%. The effective federal funds rate averaged 3.88% in October, and the Fed’s next meeting is December 8 and 9. Basically, a labor market this firm gives policymakers less reason to hurry, and the next inflation reading arrives Tuesday, Nov. 10, when October CPI is due at 8:30 a.m. ET.
Meanwhile, earnings season kept going.
Three Earnings Reports That Moved Stocks This Week
Apple (AAPL) reported on Nov. 2 and the numbers were clean. Revenue hit a September-quarter record of $114.5 billion, up 12%, and diluted EPS came in at $2.10, up 14%, according to the company’s earnings release. Services reached an all-time high. To be fair, the 47.9% gross margin included roughly one point from tariff refunds, and EPS got a $0.05 lift from them, so the underlying beat was a little smaller than the headline. I own Apple shares, so that margin detail is the part I’m watching. The stock finished the week at $342.37, down 0.66%.
Airbnb (ABNB) reported after the close on Thursday, and the market liked it: shares jumped 11.67% on Friday to $189.99. Nights and seats booked rose 16% to 155.0 million, and gross booking value climbed 21% to $27.7 billion, per the company’s shareholder letter. Revenue came in at $4.87 billion, and management raised its full-year growth outlook, according to The Closing Print.
On the other side, Axon Enterprise (AXON) fell 18.18% to $313.00 after missing on earnings and revenue and cutting its growth guidance. Coherent (COHR) rose 13.58% to $192.81 as optical and AI-infrastructure names bounced off Thursday’s low.
But the stock that told the story of the week best was a chipmaker that reported a record quarter and still lost 11%.
A Record Quarter, a Higher Forecast and Still an 11% Weekly Loss
AMD reported on Nov. 3. Third-quarter revenue was a record $13.4 billion, up 45% from a year earlier, and non-GAAP earnings per share rose 74% to $2.09. Data Center revenue nearly doubled to $8.5 billion, up 97%, per the company’s press release. The fourth-quarter forecast came in around $17 billion, ahead of the $16.23 billion analysts expected.
The stock still gave it all back and then some. AMD closed at $504.80 on Oct. 30 and $488.78 on Wednesday, then fell 17.26% on Thursday to $404.40. Friday’s 11.04% bounce lifted it to $449.04, which leaves the stock down 11.05% for the week. The business news in between was the same. What changed was the market’s willingness to pay for AI growth.
Nvidia (NVDA) went through the same wringer. It lost 8.80% for the week to $186.64, including a 9.26% drop on Thursday, before bouncing 2.78% on Friday. It reports third-quarter fiscal 2027 results on Tuesday, Nov. 17.
I covered AMD’s challenge to Nvidia in this recent video:
So is AMD cheap after a week like this? Not really. Hear me out.
What a Discounted Cash Flow Model Says This Chip Stock Is Worth
I calculate the fair value of AMD based on a discounted cash flow model. I start with 2026 revenue of about $52.2 billion, which is the first three quarters as reported plus $17 billion for the fourth quarter at the midpoint of guidance. Free cash flow margin starts at 13.3%, the nine-month figure. Revenue then grows 30% a year for five years in my base case, reaching about $194 billion in 2031, while the margin climbs to 24%. After that, growth fades to 3% over five more years, and I use 3% for the terminal growth rate. I add $8.7 billion of net cash ($15.8 billion of cash and short-term investments less $7.1 billion of debt) and divide by 1.661 billion diluted shares.
| Scenario | Revenue growth (5 yrs) | Target FCF margin | 12% discount rate | 11% discount rate | 10% discount rate |
|---|---|---|---|---|---|
| Bear | 20% | 18% | $159 | $182 | $212 |
| Base | 30% | 24% | $342 | $395 | $464 |
| Bull | 40% | 28% | $643 | $748 | $885 |
At an 11% discount rate, the base case gives $395 a share. Moving the discount rate between 12% and 10% gives a fair value band of $342 to $464, and that is the “fairly valued” zone in the chart below. At $449.04, the stock sits inside that band, near the top, and about 14% above the base case at 11%.
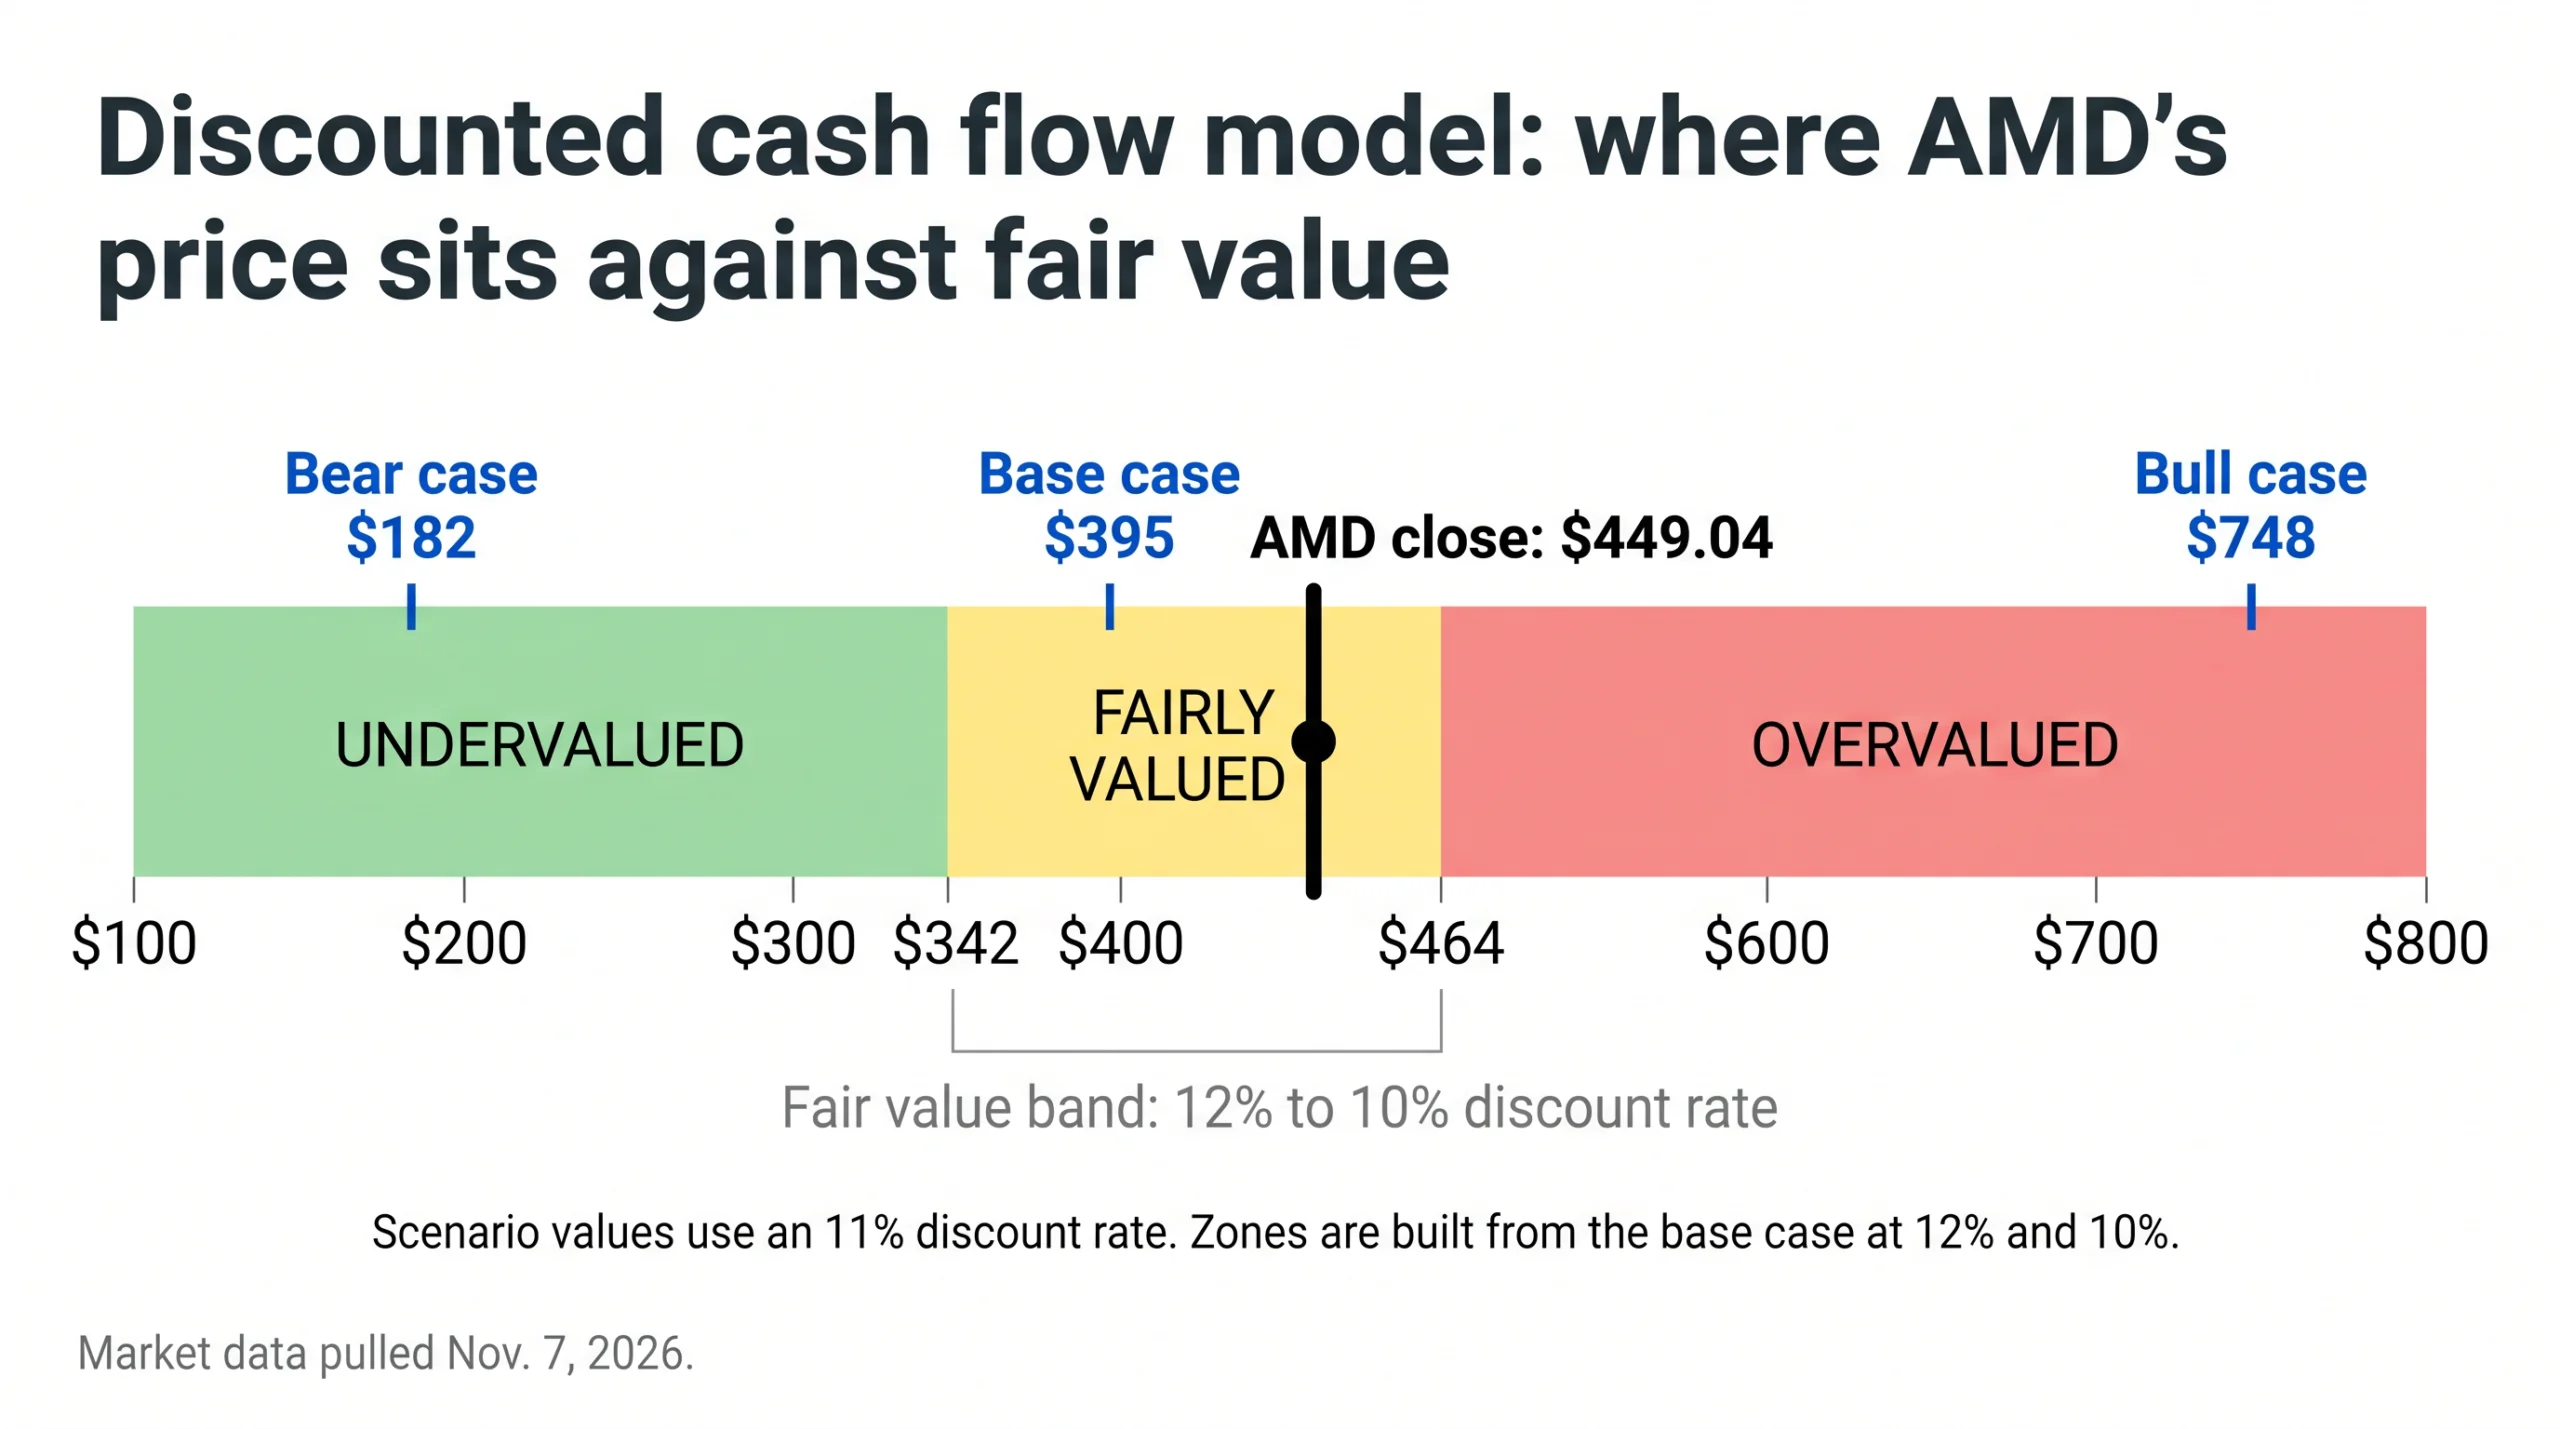
The point is how wide the spread is. The stock needs roughly 30% revenue growth for five straight years just to look fairly priced, and the bear case lands at $182. That gap comes down to two assumptions, growth and margin, and Thursday showed how fast the market can change its mind on the first one.
That still leaves room for a bullish trade with a defined limit on the risk.
A Bull Call Spread That Caps the Risk on a Chip Rebound
The goal of this trade is to profit if AMD keeps rebounding through mid-December while limiting what a stock that moved 17% down and 11% up in two sessions can cost you. A bull call spread does that by buying one call and selling a higher-strike call against it.
Here is the setup: buy the December 18, 2026 $450 call and sell the December 18 $550 call, about six weeks out. At Friday’s close, the $450 call last traded at $40.00 and the $550 call at $8.97. That makes the net debit $31.03 a share, or $3,103 per spread.
| Item | Figure |
|---|---|
| Net debit (Friday’s close) | $31.03 a share, $3,103 per spread |
| Max loss | $3,103, if AMD closes at or below $450 on Dec. 18 |
| Max profit | $6,897, if AMD closes at or above $550 |
| Breakeven | $481.03, about 7.1% above Friday’s close |
| Reward to risk | About 2.2 to 1 |
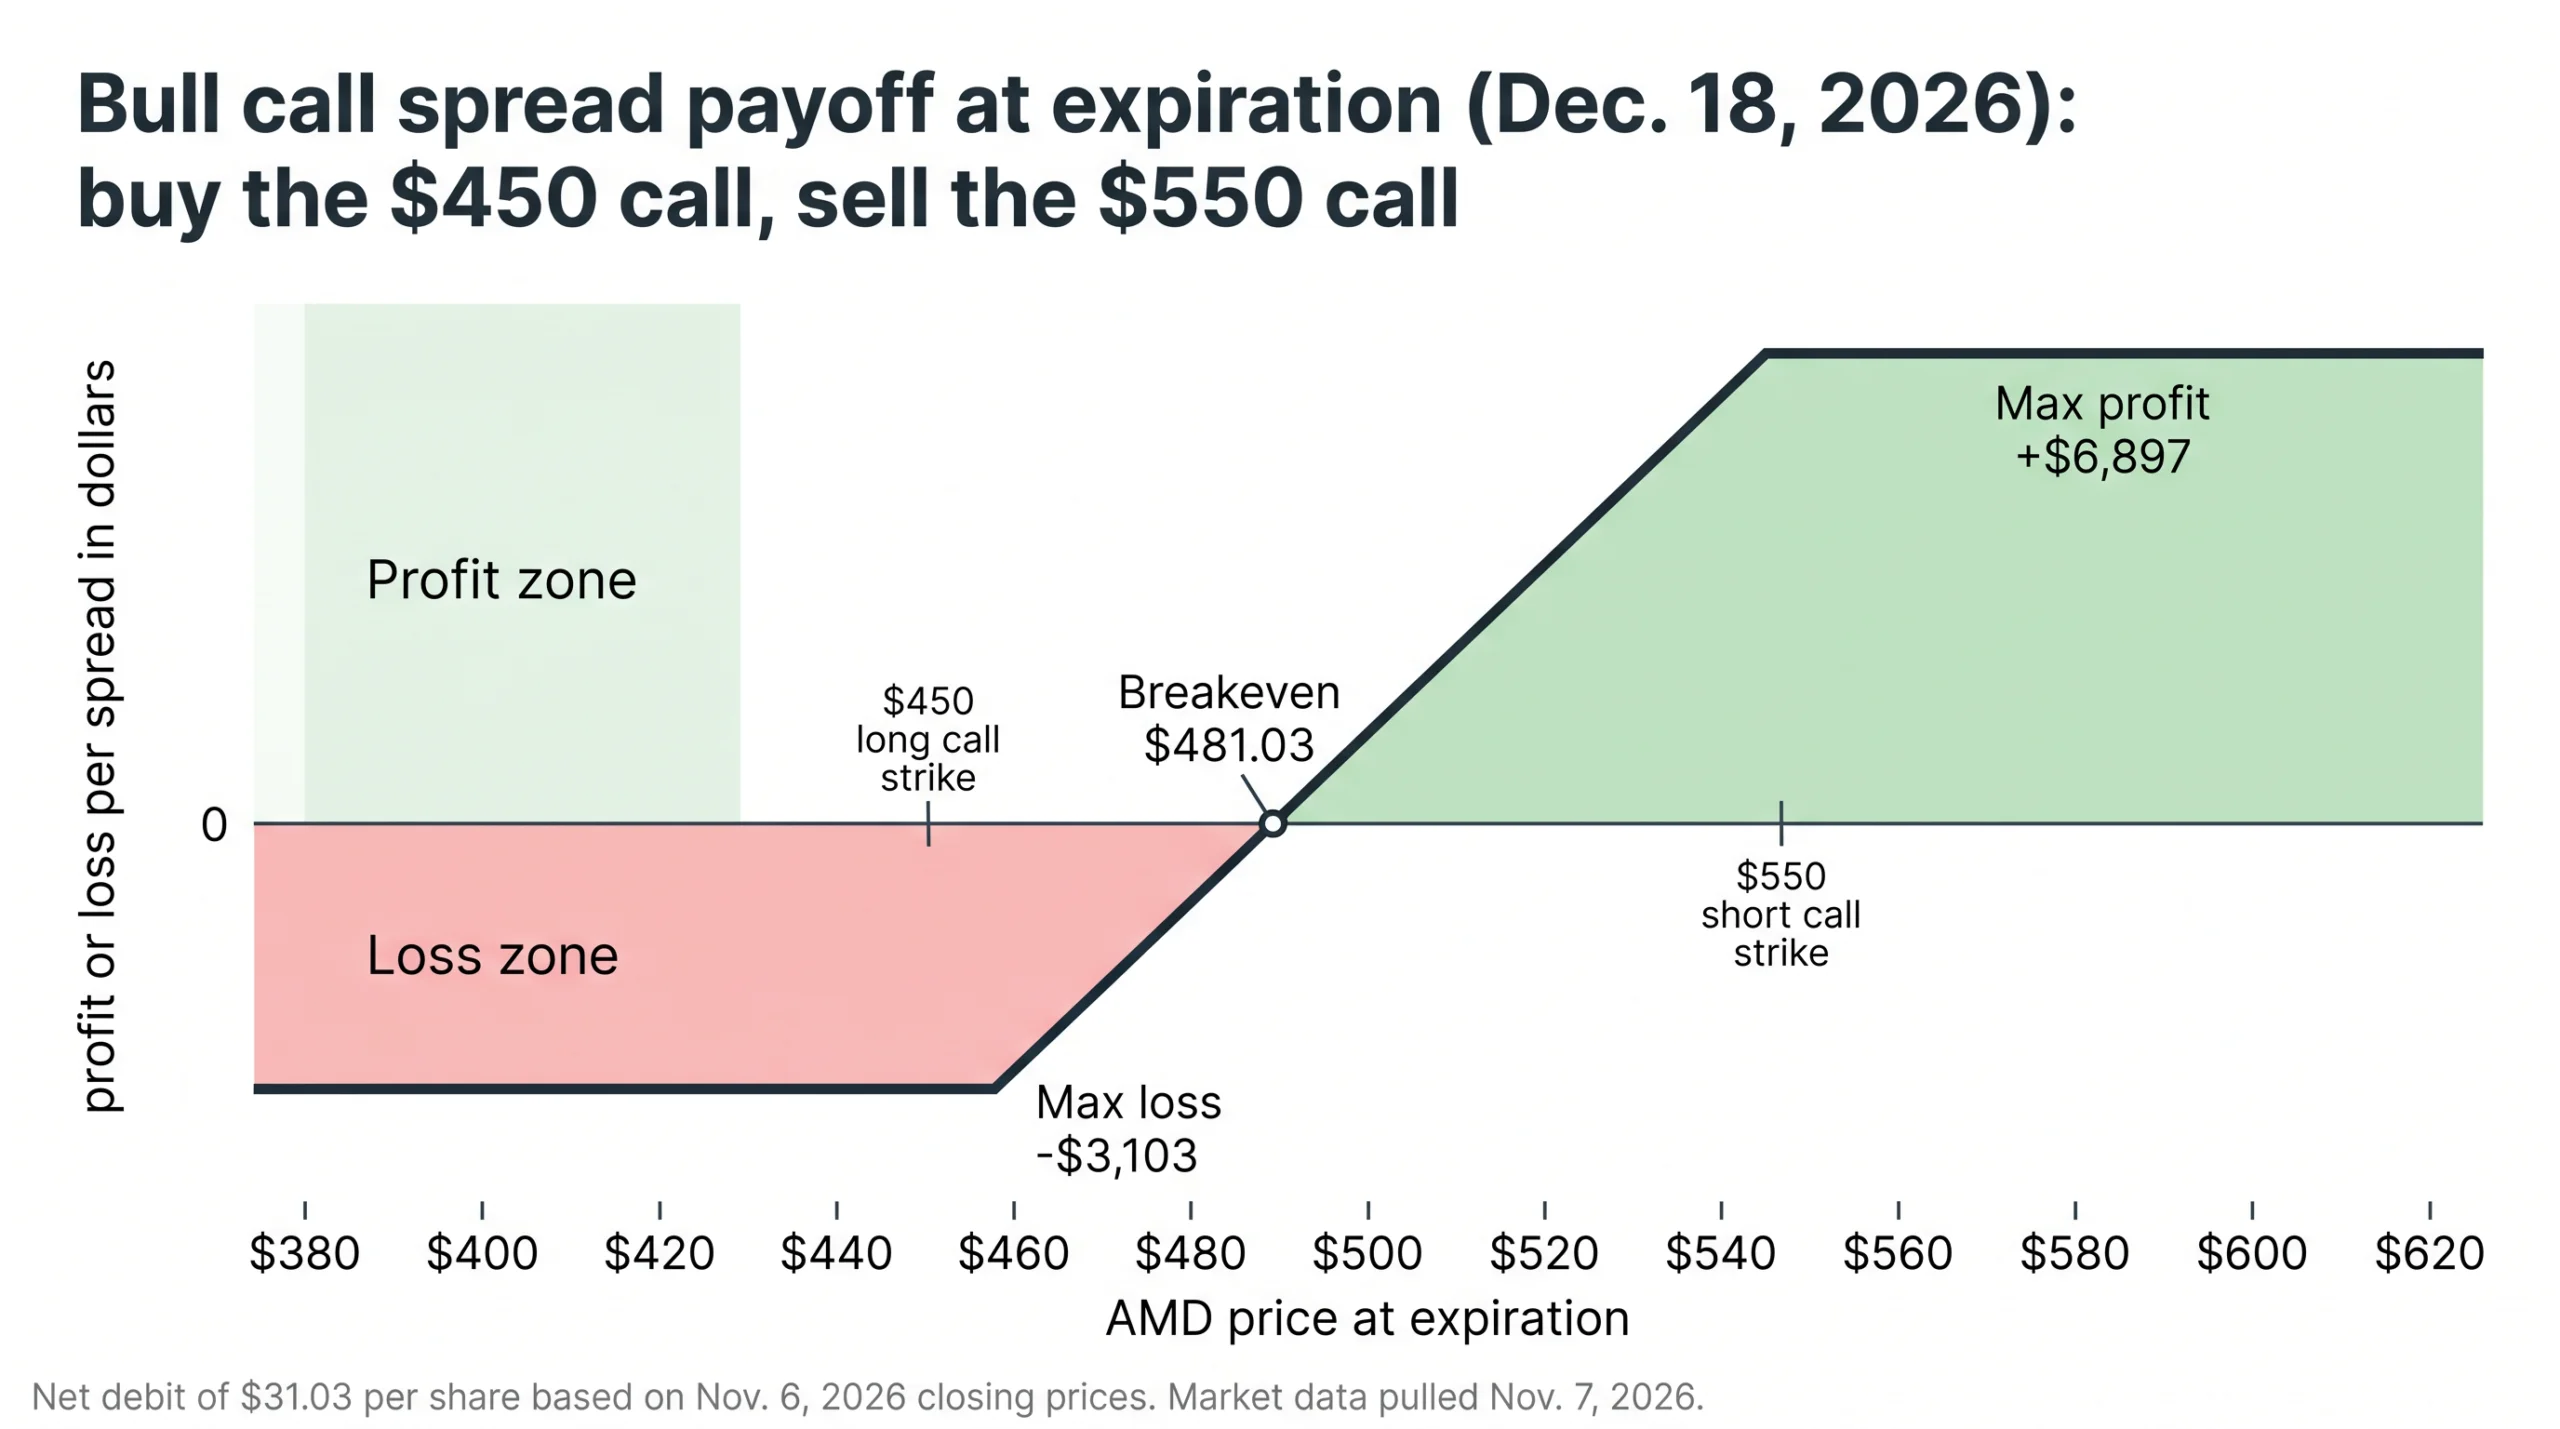
Now, the trade is a short-term bet on the rebound, not a statement that the stock is cheap. My model puts AMD at fair value at best. The spread works only if the stock climbs about 7.1% by expiration, and it pays the most only if it gains 22.5%, so a flat or falling stock loses the full $3,103. Check live quotes before placing anything, because the debit will move with the stock and with implied volatility.
The Risks That Could Reverse Friday’s Chip Bounce
Start with regulation. This week’s selloff began with worries that tighter AI and data-center rules could slow the buildout, and nothing in Friday’s bounce settled that. Data Center revenue was $8.5 billion of AMD’s $13.4 billion in the quarter, nearly two-thirds of sales, so any slowdown in AI orders lands directly on the business.
The cushion is real. AMD ended the quarter with $8.7 billion of net cash, and the $17 billion fourth-quarter forecast implies about 27% sequential growth from $13.4 billion. But the one concern that matters is valuation. At 30% growth for five years, the stock is fairly priced. In my bear case, with 20% growth and a lower margin, it is worth less than half of Friday’s close.
Macro adds to it. A 4.86% 10-year yield makes distant cash flows worth less, and that is exactly what a growth-stock discounted cash flow model measures. A hot CPI print next week would push on the same lever, which brings us to next week’s calendar.
What to Watch Next Week and Into December
- Nov. 9: Rocket Lab (RKLB) reports third-quarter earnings after the close, an estimated date per The Closing Print.
- Nov. 10: October CPI at 8:30 a.m. ET, plus earnings from Nebius (NBIS) and, after the close, Oklo (OKLO).
- Nov. 17: Nvidia’s third-quarter report, with the call at 5 p.m. ET.
- Dec. 8 and 9: The Fed’s next policy meeting.
Friday’s bounce was real, but the VIX is still above 25. CPI and Nvidia’s report now carry more weight than usual.
This article is for informational and educational purposes only. It is not financial, investment, tax or legal advice, and it is not a recommendation to buy, sell or hold any security. I am not a registered investment advisor, so consult a licensed professional before investing. On the date of publication, I had positions in Apple/AAPL. Investing involves risk, including the possible loss of principal, and past performance does not guarantee future results. Options involve risk and are not suitable for all investors. Review the Options Clearing Corporation’s disclosure document, Characteristics and Risks of Standardized Options, before trading. Analyst estimates, price targets and the valuation scenarios in this article are illustrations based on assumptions, not predictions, and actual results may differ materially. Market data pulled November 7, 2026. Figures may be delayed or contain errors and change quickly, so verify current numbers before acting. Analyst ratings and other third-party views are reported as news and are not endorsed by me. Information may have changed since publication.